Your stock item page explained
A tour of a stock item's page in ProfitClerk: stock and cost at a glance, how it sells, its timeline from purchase to sale, FIFO lots and monthly history.
Each item in your stock has its own page with everything about it: how many are left and what they cost, how well it sells, its timeline from purchase to sale, its FIFO lots and a month-by-month history of buys and corrections. Open it by clicking the product name on Inventory, or by tapping the item on the app's Stock tab.
The top of the page
Under the item's name you may see a Low stock badge and its Category, Brand and Label tags. Owners and managers have two buttons:
- Edit details: change the SKU, name, storage location, category, brand and label, or correct the remaining quantity. See restock or correct quantities.
- Delete: removes the item after you confirm "Remove this inventory item?".
In the app, Restock and Edit sit under the stock count, and Delete item is in the menu at the top right.
At a glance
- Remaining, Stock value (avg) and Avg cost / unit (on hand).
- Product and SKU.
- FIFO cost / unit (open lots): the cost of the units still in open lots.
- Ever bought, Total cost paid (ever) and Lifetime avg / unit.
Next to it, Restock this SKU records a new buy. See stock value.
How it sells
How it sells covers every sale of the item so far:
- Units sold;
- ROI and Margin, over sales that have an item cost;
- Avg. days to sell, with the fastest and slowest.
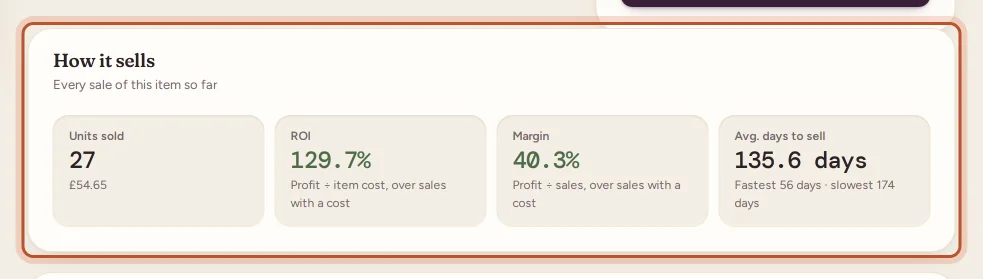
See margin, ROI and days to sell.
Product timeline
The Product timeline tells the item's story, oldest first.
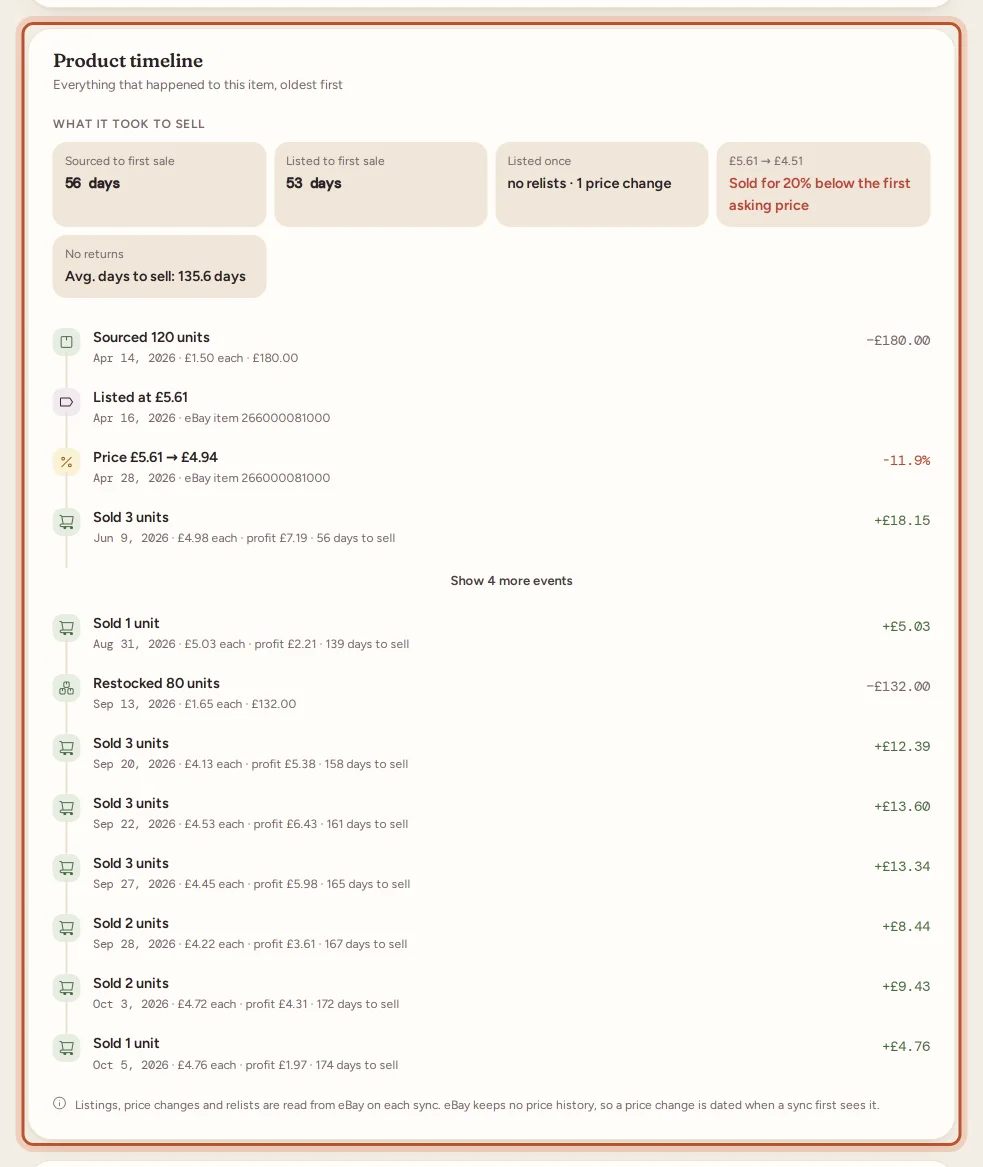
At the top, What it took to sell:
- Sourced to first sale and Listed to first sale (or Not sold yet);
- how many times it was listed, relisted and changed price;
- how the sale price compares with the first asking price, for example "Sold for 12% below the first asking price";
- how many returns.
Below come the events: sourced and restocked units with their cost, stock adjustments, listings and relists with their price, price changes, ended listings, and each sale with its price, profit and days to sell. Refunds are marked. Click Show … more events to see them all.
Listing events are read from eBay on each sync. eBay keeps no price history, so a price change is dated when a sync first sees it.
Open lots (FIFO layers)
Each delivery of the item is its own layer. Sales use up the oldest layer first, at that layer's price. For each open lot you see when it was received, how many units are left of how many, the unit cost and how much of it is used, and which lot Sells next. See how item costs flow into profit.
Month in review
Choose a Month and Year and click Apply to see:
- Month costs: Qty added, Purchase avg, Qty sold and Sale cost avg, plus that month's sales profit and revenue;
- Restock history: every buy that month, with where it came from; a buyer's return put back on the shelf is tagged Returned by a buyer;
- Remaining quantity adjustments: every correction by hand, with its note.
In the app
The app's item page shows the same information: the stock count with … of … ever bought and the value on hand, tiles for Cost per unit, Stock value and Ever bought, then How it sells, FIFO lots, Restocks, Changes by hand and the Product timeline.
Questions people ask
How do I open a stock item's page?
On the website, click the product name on Inventory. In the app, tap the item on the Stock tab.
What happens if I delete a stock item?
It is removed with its lots and history. Sales already made keep their costs and stay in your reports, but future sales of that SKU will be unmatched and have no item cost.
Why does the timeline date a price change later than I made it?
eBay keeps no price history, so a price change is dated when a ProfitClerk sync first sees it.
What is the difference between Avg cost / unit and Lifetime avg / unit?
Avg cost / unit (on hand) is the average used for the units on the shelf now. Lifetime avg / unit is everything you ever paid for the item divided by every unit you ever bought.
Thanks for telling us.